

The AFL ladder is the official table that tracks where every team in the Australian Football League sits during the home-and-away season.
In addition, clubs rank first by total premiership points, second by percentage if points are equal, and finally by points scored if the first two tie. For example, each win earns 4 points, while a draw earns 2 points, and a loss earns 0 points.
Moreover, the 2026 AFL season features 25 home-and-away rounds, followed by the brand-new top-10 Wildcard finals system. As a result, this format replaces the traditional top-8 system that ran from 1994 to 2025.
Therefore, this guide breaks down every ladder column, the percentage formula, the tie-breaker rules, and how the new top-10 finals system works in 2026.
How Are AFL Ladder Points Calculated?
Premiership points are the foundation of the AFL ladder. Each match result earns a fixed number of points regardless of margin, score, or opposition.
| Result | Premiership Points |
|---|---|
| Win | 4 |
| Draw | 2 |
| Loss | 0 |
| Bye | 0 |
Note: Teams do not earn points from byes. The AFL schedules bye rounds across the season to give teams rest weeks, especially during representative football periods.
How Is AFL Percentage Calculated?
Percentage is the AFL’s primary tie-breaker. It measures how many points a team has scored compared to how many they have conceded across all matches.
The formula is:
Percentage = (Total Points For ÷ Total Points Against) × 100
A percentage above 100% means the team has scored more points than they have conceded. A percentage below 100% means they have conceded more.
Example Percentage Calculation
If a team has scored 974 points across all matches and conceded 1,075 points, the percentage works out to:
(974 ÷ 1,075) × 100 = 90.60%
This means for every 100 points scored against this team, the team has only managed 90.60 points in return. A weak attacking and defensive return overall.
Higher Percentage Examples
| Team | Points For | Points Against | Percentage |
|---|---|---|---|
| Sydney Swans | 814 | 457 | 178.12% |
| Geelong Cats | 2,194 | 1,647 | 133.21% |
| Melbourne Demons | 697 | 678 | 102.80% |
| North Melbourne | 1,891 | 1,722 | 109.81% |
| Western Bulldogs | 1,591 | 1,696 | 93.81% |
Sydney Swans’ 178.12% (using 2026 Round 7 numbers) shows how a dominant attacking and defensive team can build a huge percentage gap. This makes them virtually impossible to overtake on the ladder if a tie-breaker is needed.
Understanding the AFL Ladder Columns
Most AFL ladder displays use the same standard set of columns. Below is a quick reference for each column and what it means.
| Column | Full Name | What It Means |
|---|---|---|
| Pos | Position | The team’s current rank on the ladder |
| P | Played | Total games played so far |
| W | Won | Games won in the season |
| L | Lost | Games lost in the season |
| D | Drawn | Games that finished as a tie |
| F | Points For | Total points the team has scored |
| A | Points Against | Total points the team has conceded |
| % | Percentage | (F ÷ A) × 100 |
| Pts | Premiership Points | Total of W × 4 + D × 2 |
Some ladder displays also show STRK (current streak) and SF (recent form), although these are visual aids and do not affect ladder position.
Example AFL Ladder Table (Mid-Season Scenario)
Below is a sample mid-season ladder showing how different combinations of wins, percentage, and points play out across 18 teams.
| Pos | Team | P | W | L | D | F | A | % | Pts |
|---|---|---|---|---|---|---|---|---|---|
| 1 | Team A | 10 | 9 | 1 | 0 | 1,000 | 700 | 142.86 | 36 |
| 2 | Team B | 10 | 8 | 2 | 0 | 950 | 750 | 126.67 | 32 |
| 3 | Team C | 10 | 6 | 4 | 0 | 900 | 850 | 105.88 | 24 |
| 4 | Team D | 10 | 5 | 4 | 1 | 850 | 850 | 100.00 | 22 |
| 5 | Team E | 10 | 5 | 4 | 1 | 800 | 820 | 97.56 | 22 |
| 6 | Team F | 10 | 4 | 6 | 0 | 750 | 800 | 93.75 | 16 |
What This Example Tells Us
Team D and Team E are tied on 22 points. Both have 5 wins, 4 losses, and 1 draw. However, Team D is ranked higher (4th) because their percentage of 100.00% is higher than Team E’s 97.56%. This is the most common type of ladder tie-breaker scenario across the AFL season.
What Happens If Two Teams Are Tied on Points and Percentage?
The AFL has a clear hierarchy of tie-breakers if two or more teams are level on premiership points. The order below applies if any club ties with another at the end of the season.
- First: Premiership Points (most important)
- Second: Percentage (Points For ÷ Points Against × 100)
- Third: Total Points For (highest number wins)
- Fourth: Head-to-head record between the tied clubs
- Fifth: Drawn from a hat (very rare last-resort method)
Tie-breakers below percentage almost never come into play. The AFL records show that head-to-head and drawn-from-hat rules have almost never been needed at the senior level.
How the AFL Ladder Determines Finals Qualification
The 2026 AFL season introduces a new finals format. Below is how the home-and-away ladder rolls into the finals series this year.
2026 Finals Format: Top-10 Wildcard System
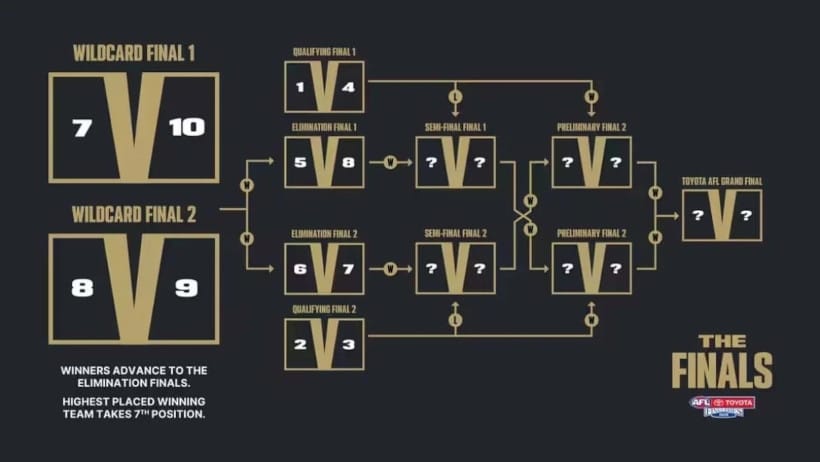
For the first time in AFL history, the top 10 teams qualify for the finals via a new wildcard knockout system. This replaces the top-8 final format used from 1994 to 2025.

| Ladder Position | Pathway |
|---|---|
| 1st to 4th | Direct entry to Qualifying Finals (top-4 advantage) |
| 5th to 8th | Enter Elimination Finals |
| 9th to 10th | Wildcard Round (winners advance to Elimination Finals) |
| 11th to 18th | Season ends — no finals |
The top 4 teams retain the traditional “double chance” advantage, meaning they remain in the finals even if they lose their first match. Teams ranked 5 to 10 must win every match to survive to the next week.
Key Dates for 2026 AFL Finals
The 2026 finals series is significantly longer than previous years thanks to the new top-10 format.
- Home-and-away season: 25 rounds
- Wildcard Round: After Round 25
- Elimination Finals: Following the Wildcard Round
- Qualifying Finals, Semi Finals, Preliminary Finals: Standard knockout
- AFL Grand Final: Late September 2026 at the MCG
How Often Is the AFL Ladder Updated?
The AFL updates the ladder immediately after each match across each round. With multiple matches per round and double-headers on Saturdays, the ladder can change several times in a single weekend.
- Live updates: Available on AFL.com.au, ESPN, and Fox Sports during matches
- End-of-round updates: Final positions confirmed after the last match of each round
- Mid-season updates: Reflect the result of each match within minutes
- Bye-week handling: Teams on the bye keep the same points and percentage as their previous round
- Wildcard implications: Each round can shift teams in and out of the top 10 finals zone
Why Percentage Matters at the End of the Season
Percentage often decides which team finishes inside the top 10 in tight finishes. Two key historical examples show why every point counts.
2022 Example: Top-8 Cut-off
In 2022, Western Bulldogs finished 8th with the same 12-9 record as 9th-placed Carlton. Bulldogs had 110.5% versus Carlton’s 109.7%, meaning a 0.8% gap was the only thing separating finals action from missing out.
2025 Example: Top-4 Battle
In 2025, the gap between 4th and 5th place came down to less than 5% across the entire 23-round season. The 4th-placed team retained the double chance because of a single big-margin win earlier in the year.
Tactical Implications
Coaches and clubs actively focus on percentage as a season-long target. Specifically, teams chase big-margin wins late in matches even when the scoreboard has already settled the result, and they avoid late slumps that inflate “Points Against” totals.
Conclusion: The AFL Ladder Tells the Story of the Season
The AFL ladder is the most important reference point throughout the home-and-away season. It tells fans, players, and coaches exactly where their team stands, who they need to catch, and what they must do to make the finals.
With the 2026 introduction of the top-10 Wildcard finals system, two more teams now have a path into September football, and the ladder battle stretches deeper into the standings than ever before.
Every match win adds 4 points, every draw adds 2 points, and every percentage point can be the difference between making the top 10 or watching the finals from the couch. Bookmark afl.com.au or footywire.com.au for live ladder updates throughout the 25-round season.
AFL Ladder FAQs
There are 18 teams on the AFL ladder representing the 18 men’s clubs in the Australian Football League.
To calculate percentage, divide the total points scored by the total points conceded, then multiply by 100. A percentage above 100% means the team has scored more than they have conceded.
4 premiership points for a win, 2 for a draw, and 0 for a loss. There are no bonus points for big wins or losing bonus points like rugby union.
No. The AFL is a closed competition with 18 fixed teams. There is no promotion from a lower division and no relegation to one.
The wooden spoon goes to the team that finishes 18th (last) on the ladder at the end of the home-and-away season. The 2026 wooden spoon will be confirmed after Round 25.
Teams on the bye keep their existing points, percentage, and ranking. Other teams who play that round can move up or down depending on their results.
The ladder resets at the start of every season in March. All teams begin with 0 points, 0 percentage, and 0 wins on the new ladder.